Renault's India-only sub-4-metre 7-seat MPV since the 19 June 2019 unveil and 28 August 2019 first prices, on CMF-A+ (Kwid family), built at Chennai (Renault Nissan). One generation, two bodies on the map: the original 28 August 2019 look (RXE/RXL/RXT/RXZ, EasyFix 7-seat) and the current 23 July 2025 facelift (new diamond logo, LED projectors, dual-tone dash, 6 airbags standard). 1.0 Dual VVT petrol 5MT/5AMT only; no factory diesel or CNG (MT CNG retrofit). 29 April 2026 auto-AC / fold-flat pack is a feature/price refresh, not a facelift. Nissan Gravite is the related rebadge. Global NCAP 4-star adult / 3-star child on the original 2-airbag body (June 2021). No official India SIAM recall as of 19 August 2026. India launch: 28 August 2019 (unveil 19 June 2019).
Newest first — scroll down for earlier generations.
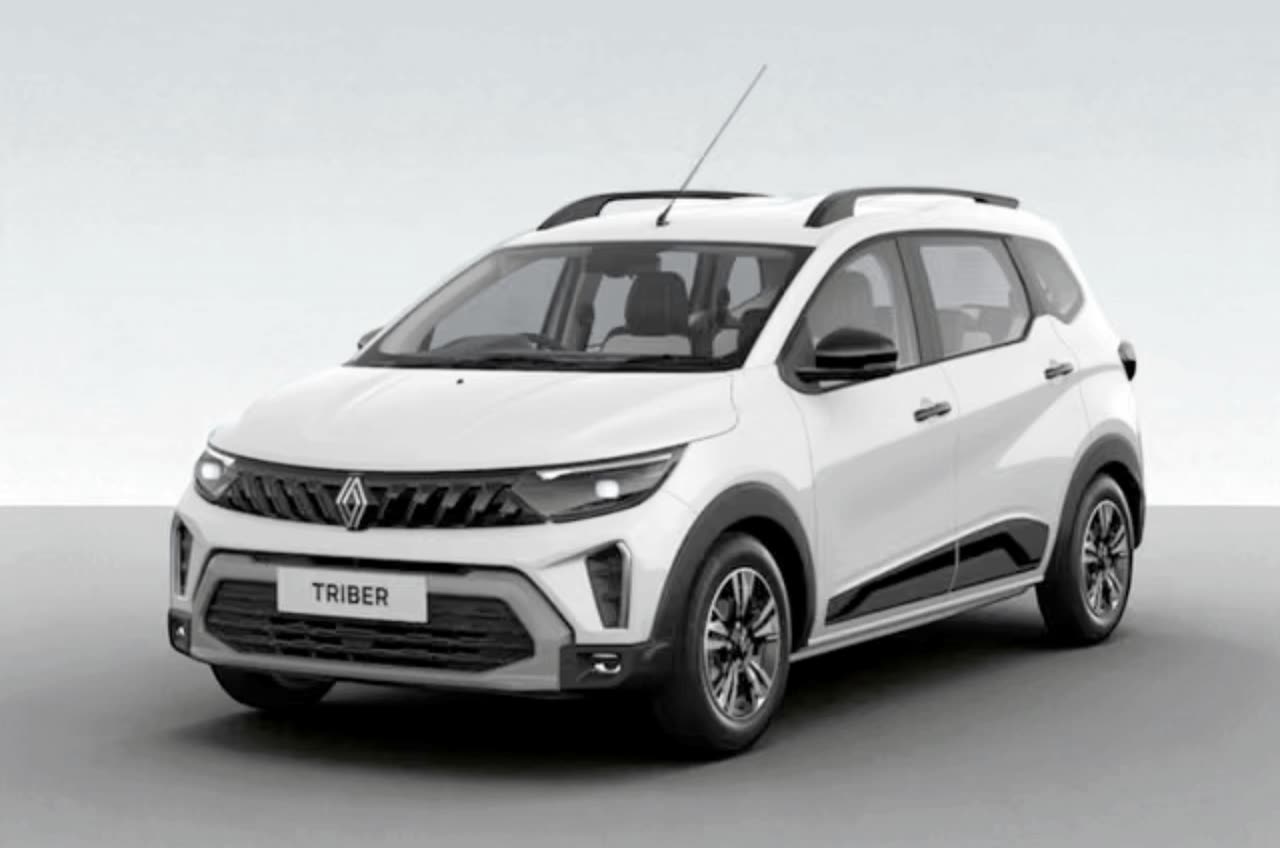
Renault · Official press image (manufacturer copyright)2025
2025–now
First-generation facelift
23 July 2025
FaceliftCurrent
What changed
Launch
Current on-sale India Triber.
Renault PR / 23 July 2025: 'All-New Triber' mid-cycle from Rs 6,29,995 Authentic (ex-showroom).
First major update since 2019.
Look
New 2D diamond logo, gloss-black grille, LED projector headlamps with DRLs, new bumper/hood/skid plates, smoked LED tails, 15-inch landscape flex wheels.
Cabin
Cabin: dual-tone dash, 20.32 cm (8-inch) floating touchscreen with wireless CarPlay/Android Auto, LED cluster.
No official India recall recorded for this generation.
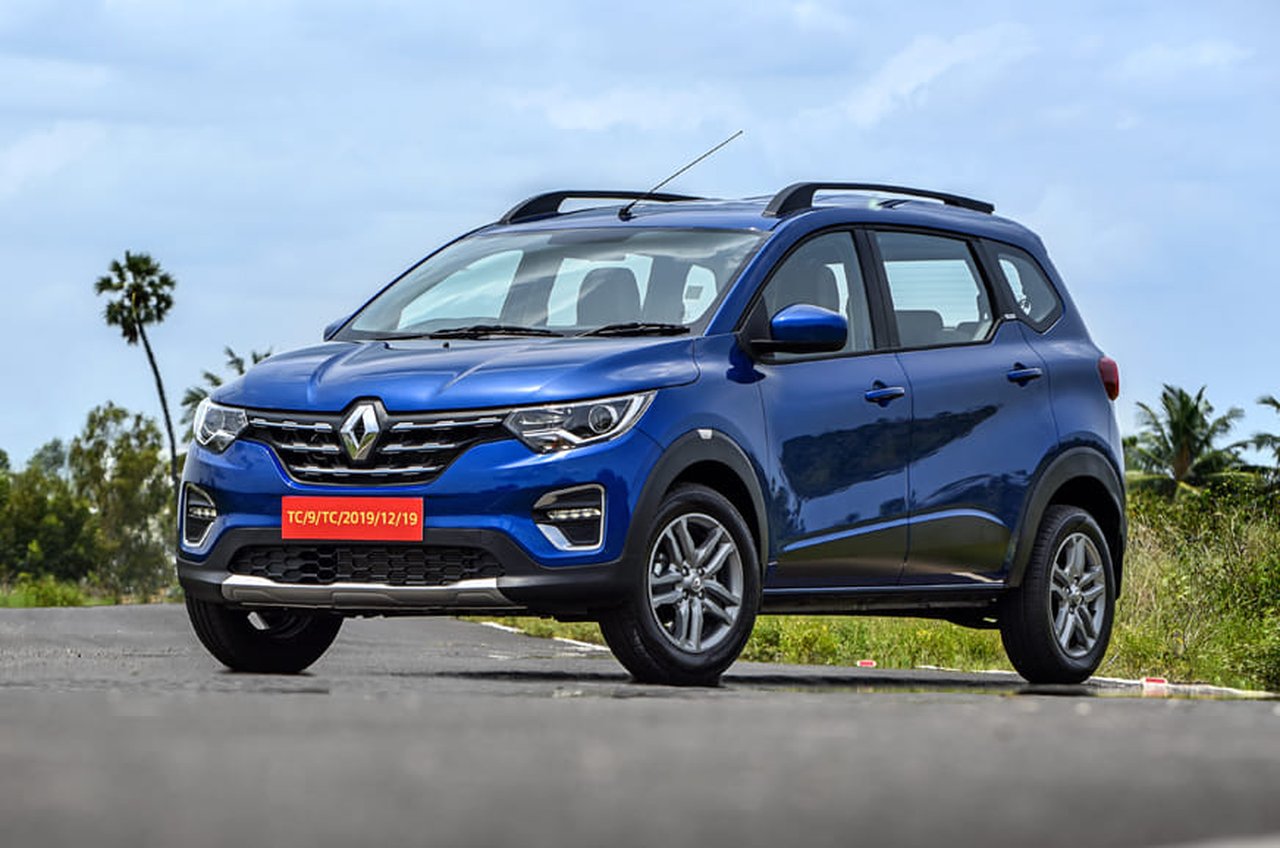
Renault · Official press image (manufacturer copyright)2019
2019–2025
First generation (original body)
28 August 2019
New gen
What changed
Launch
Original India Triber.
Unveil 19 June 2019; on-sale 28 August 2019 (Renault PR /) from Rs 4.95 lakh RXE to Rs 6.49 lakh RXZ (ex-showroom, pan-India).
Sub-4-metre 7-seat MPV priced against B-segment hatches.
Look
CMF-A+ (Kwid family): chrome-slat grille with large diamond badge, projector headlamps, LED DRLs in chrome lower housings, black wheel-arch cladding, silver skid plates, roof rails.
Launch colours include Electric Blue and Metal Mustard.
Cabin
EasyFix modular 5/6/7-seat with removable third row; dual-tone black/beige; 8-inch touchscreen on higher trims.
Trims RXE / RXL / RXT / RXZ.
Powertrain
Launch 1.0 Dual VVT 72 PS / 96 Nm + 5MT only.
18 May 2020 : Easy-R 5AMT on RXL/RXT/RXZ from Rs 6.18 lakh — not a map facelift.
No factory diesel or CNG.
Safety
Dual airbags, ABS and ISOFIX on the range; four airbags on RXZ.
Global NCAP (Renault PR 1 June 2021 /): 4-star adult (11.62/17) / 3-star child on the 2-airbag spec.
Also
Built at Chennai.
Nissan Gravite is the later rebadge of the facelifted body, not this row.
Sold until the 23 July 2025 'All-New Triber' facelift.
29 April 2026 pack is on the facelift body.
1.0 Dual VVT petrol 72 PS / 96 Nm + 5MT (5AMT Easy-R from 18 May 2020 on RXL/RXT/RXZ)
Recalls
No official India recall recorded for this generation.
Compare
Same brand stays inside Renault. Same class is other brands in the MPV segment. Picking a car swaps the dispatch log below.
Renault Triber 2026 feature update29 April 2026Equipment and price refresh on the July 2025 facelift body, not a generation or second facelift. Renault PR: auto climate control, one-touch second-row fold-and-tumble, full-flat 1,065 L boot; Authentic–Emotion from Rs 5.80 lakh (ex-showroom). Same 1.0 petrol 5MT/5AMT.
Nissan Gravite17 February 2026 (on sale March 2026)Related Chennai-built rebadge of the facelifted Triber, not a Renault Triber generation. Same CMF-A+ 7-seat package under the Nissan brand. Tracked separately in sales data.
Renault Kiger15 February 2021Related CMF-A+ compact SUV, not a Triber generation. Shares the 1.0 NA petrol; Kiger also offers a 1.0 turbo. Tracked separately.
Monthly dispatch log
Unofficial independent compilation. Figures may contain collection or display errors and are not OEM-official. Terms & disclaimer