Powertrain1.0 BR10 NA petrol 72 hp / 96 Nm + 5MT / 5AMT (Easy-R)
Max output96–160 Nm
Facelift generation map
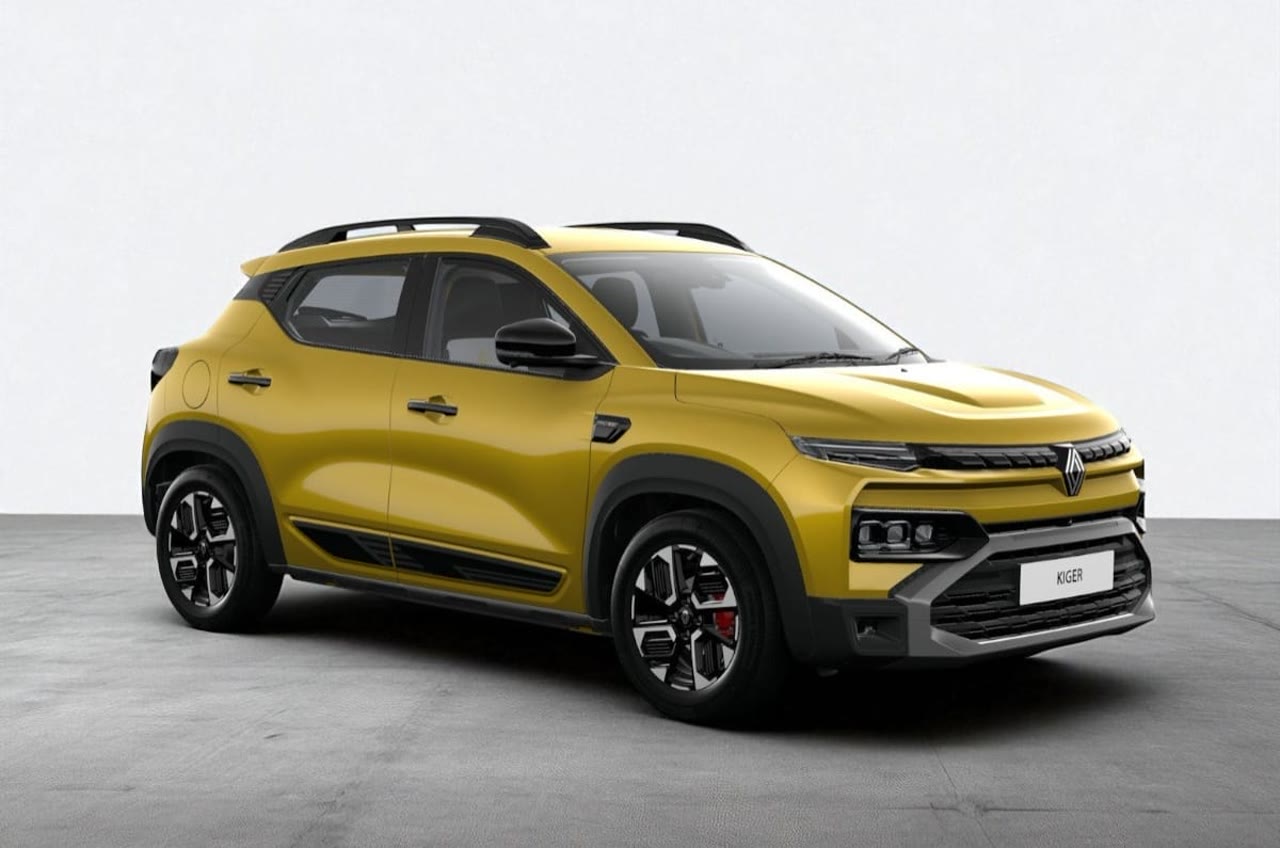
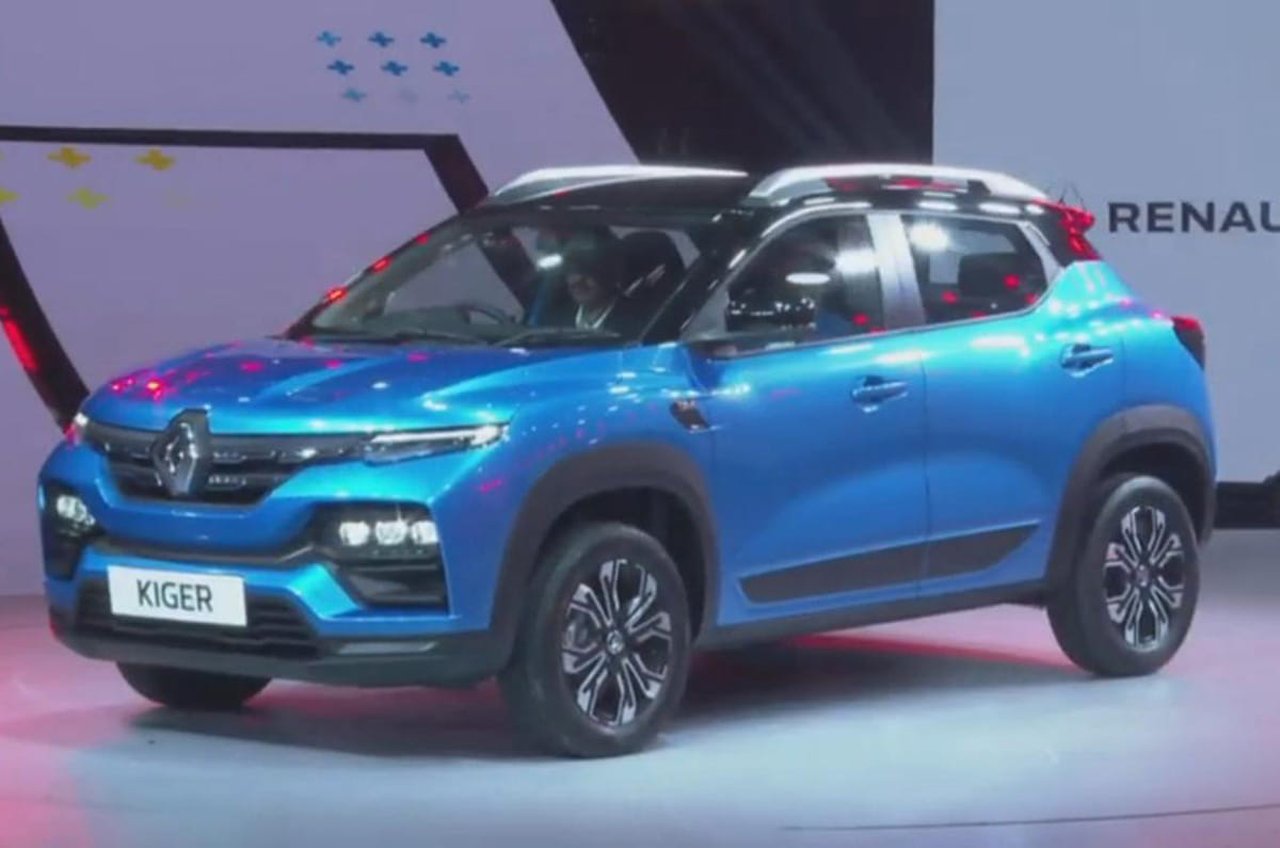
Renault's India-first CMF-A+ sub-4-metre SUV since the 28 January 2021 global unveil and 15 February 2021 first prices, built at Oragadam, Chennai (Renault Nissan) and twin to Nissan Magnite. One generation, two bodies on the map: the original 15 February 2021 look (split LED DRLs, RXE/RXL/RXT/RXZ) and the current 24 August 2025 facelift (new diamond logo, bumpers, LED lamps, 6 airbags standard). 1.0 NA 5MT/AMT and 1.0 turbo 5MT/CVT; dealer CNG on MT. 23 June 2026 Evolution+ pack is a variant expansion, not a facelift. Global NCAP 4-star adult / 2-star child on the original 2-airbag body (15 February 2022). No official India SIAM recall as of 19 August 2026. India launch: 15 February 2021 (global unveil 28 January 2021).
Newest first — scroll down for earlier generations.
Renault · Official press image (manufacturer copyright)2025
2025–now
First-generation facelift
24 August 2025
FaceliftCurrent
What changed
Launch
Current on-sale India Kiger.
Renault PR / 24 August 2025: 'New Kiger' mid-cycle from Rs 6.29 lakh Authentic NA MT to Rs 11.29 lakh Emotion turbo CVT (ex-showroom).
Also
35+ updates.
Look
New 3D diamond logo, grille, sculpted hood, bumpers/skid plates, LED headlamps/tails/fog lamps, C-pillar graphics, 16-inch (40.64 cm) diamond-cut alloys.
Kiger Evolution+ / June 2026 variant expansion23 June 2026Equipment and price refresh on the August 2025 facelift body, not a generation or second facelift. Renault PR: new Evolution+ (smart card, auto AC, wireless smartphone replication) across NA MT/AMT and turbo MT; turbo from Rs 7.89 lakh (ex-showroom). Same 1.0 NA / 1.0 turbo.
Nissan Magnite2 December 2020 (current facelift 4 October 2024)Related CMF-A+ sub-4-metre SUV twin, not a Kiger generation. Shares architecture and 1.0 engines; different styling and Nissan branding. Tracked separately.
Renault Triber28 August 2019 (current facelift 23 July 2025)Related CMF-A+ 7-seat MPV, not a Kiger generation. Shares the 1.0 NA petrol; Kiger also offers a 1.0 turbo. Tracked separately.
Monthly dispatch log
Unofficial independent compilation. Figures may contain collection or display errors and are not OEM-official. Terms & disclaimer